
Reporting Refresh
Bringing better data to users through improved reporting capabilities for digital ad campaigns
Company
Basis Technologies is both an ad agency and a comprehensive automation software provider for enterprise marketers.
Role
Staff Product Designer
Sole designer for majority of the project. An associate designer was hired onto the team a few months before MVP release.
Team
- Two Product Managers
- Two Solutions Architects
- Six Engineers
- Two UX Researchers
Problem
Basis Platform was rife with data and reporting problems.
- Data inconsistencies were present across the platform, leading to confusion and lack of trust in reporting.
- Users needed more granular and actionable data to effectively optimize ad spend and campaign performance.
- The platform was lacking better client-facing reporting options with data visualizations.
- Multiple, disparate reporting tools created uncertainty around which tool to use for specific reporting needs.
Goals
- Enhance data consistency and provide greater granularity to support more accurate and actionable insights
- Eliminate reliance on multiple third-party reporting tools, reducing annual costs by nearly $2 million
- Improve the overall reporting experience and functionality to better meet user and client needs
The project scope shifted three times due to changes in leadership, evolving business objectives, and technical constraints. Originally, the MVP was intended to replace just one of four existing reporting solutions, but the scope was later expanded to encompass all four.
Project Duration
January 2023 – present
Research
Discovery Activities
- User interviews
- Heuristic evaluations
- Competitive analysis
- Current state task flows
- Use case mapping
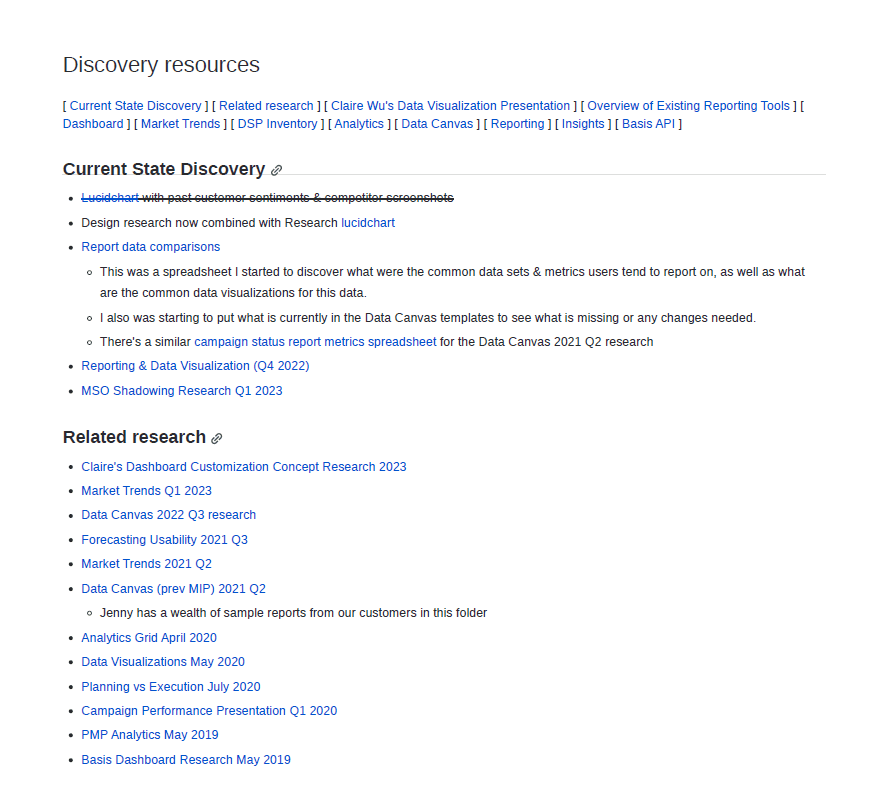
With no clearly defined requirements at the outset, we conducted extensive discovery work to better understand user needs and reporting use cases within the digital advertising space.
Several team members needed to get up to speed on our existing reporting capabilities and understand the key pain points faced by users. Having started my time at Basis working on a new dashboard solution, Data Canvas, I had deep insight into the use cases and challenges of our current reporting tools. I gathered and organized existing research and documentation for each tool to streamline the knowledge-sharing process.
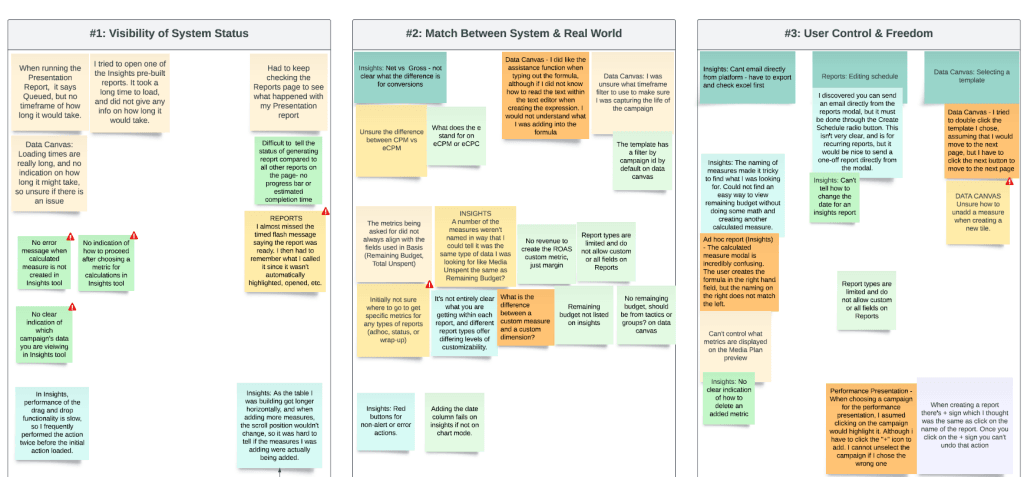
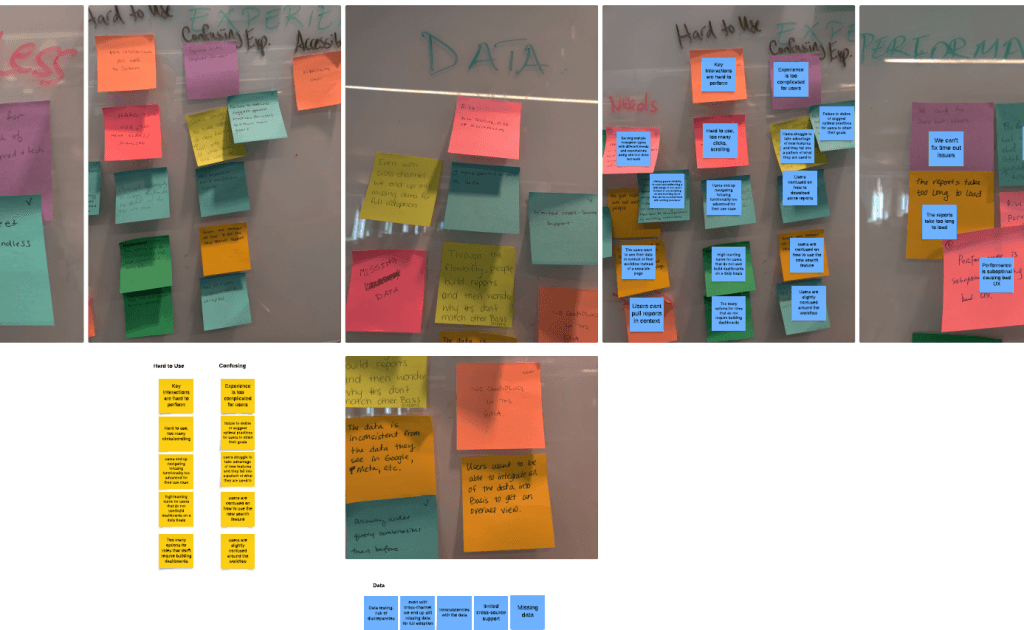
Heuristic evaluations
Team members from design, product, research, engineering, and technical writing each conducted individual heuristic evaluations of the various reporting tools within the Basis platform. We then met to share our findings, synthesize insights, and identify common themes and opportunities for improvement.
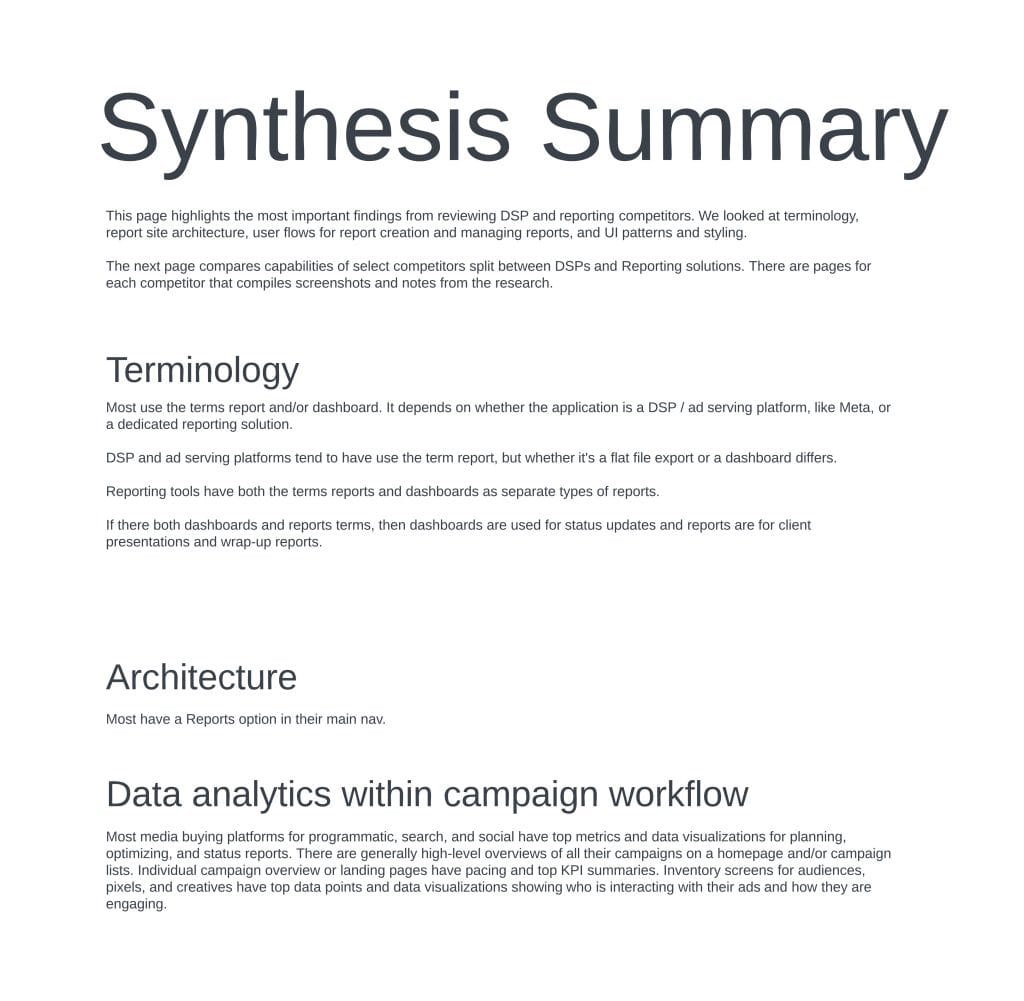
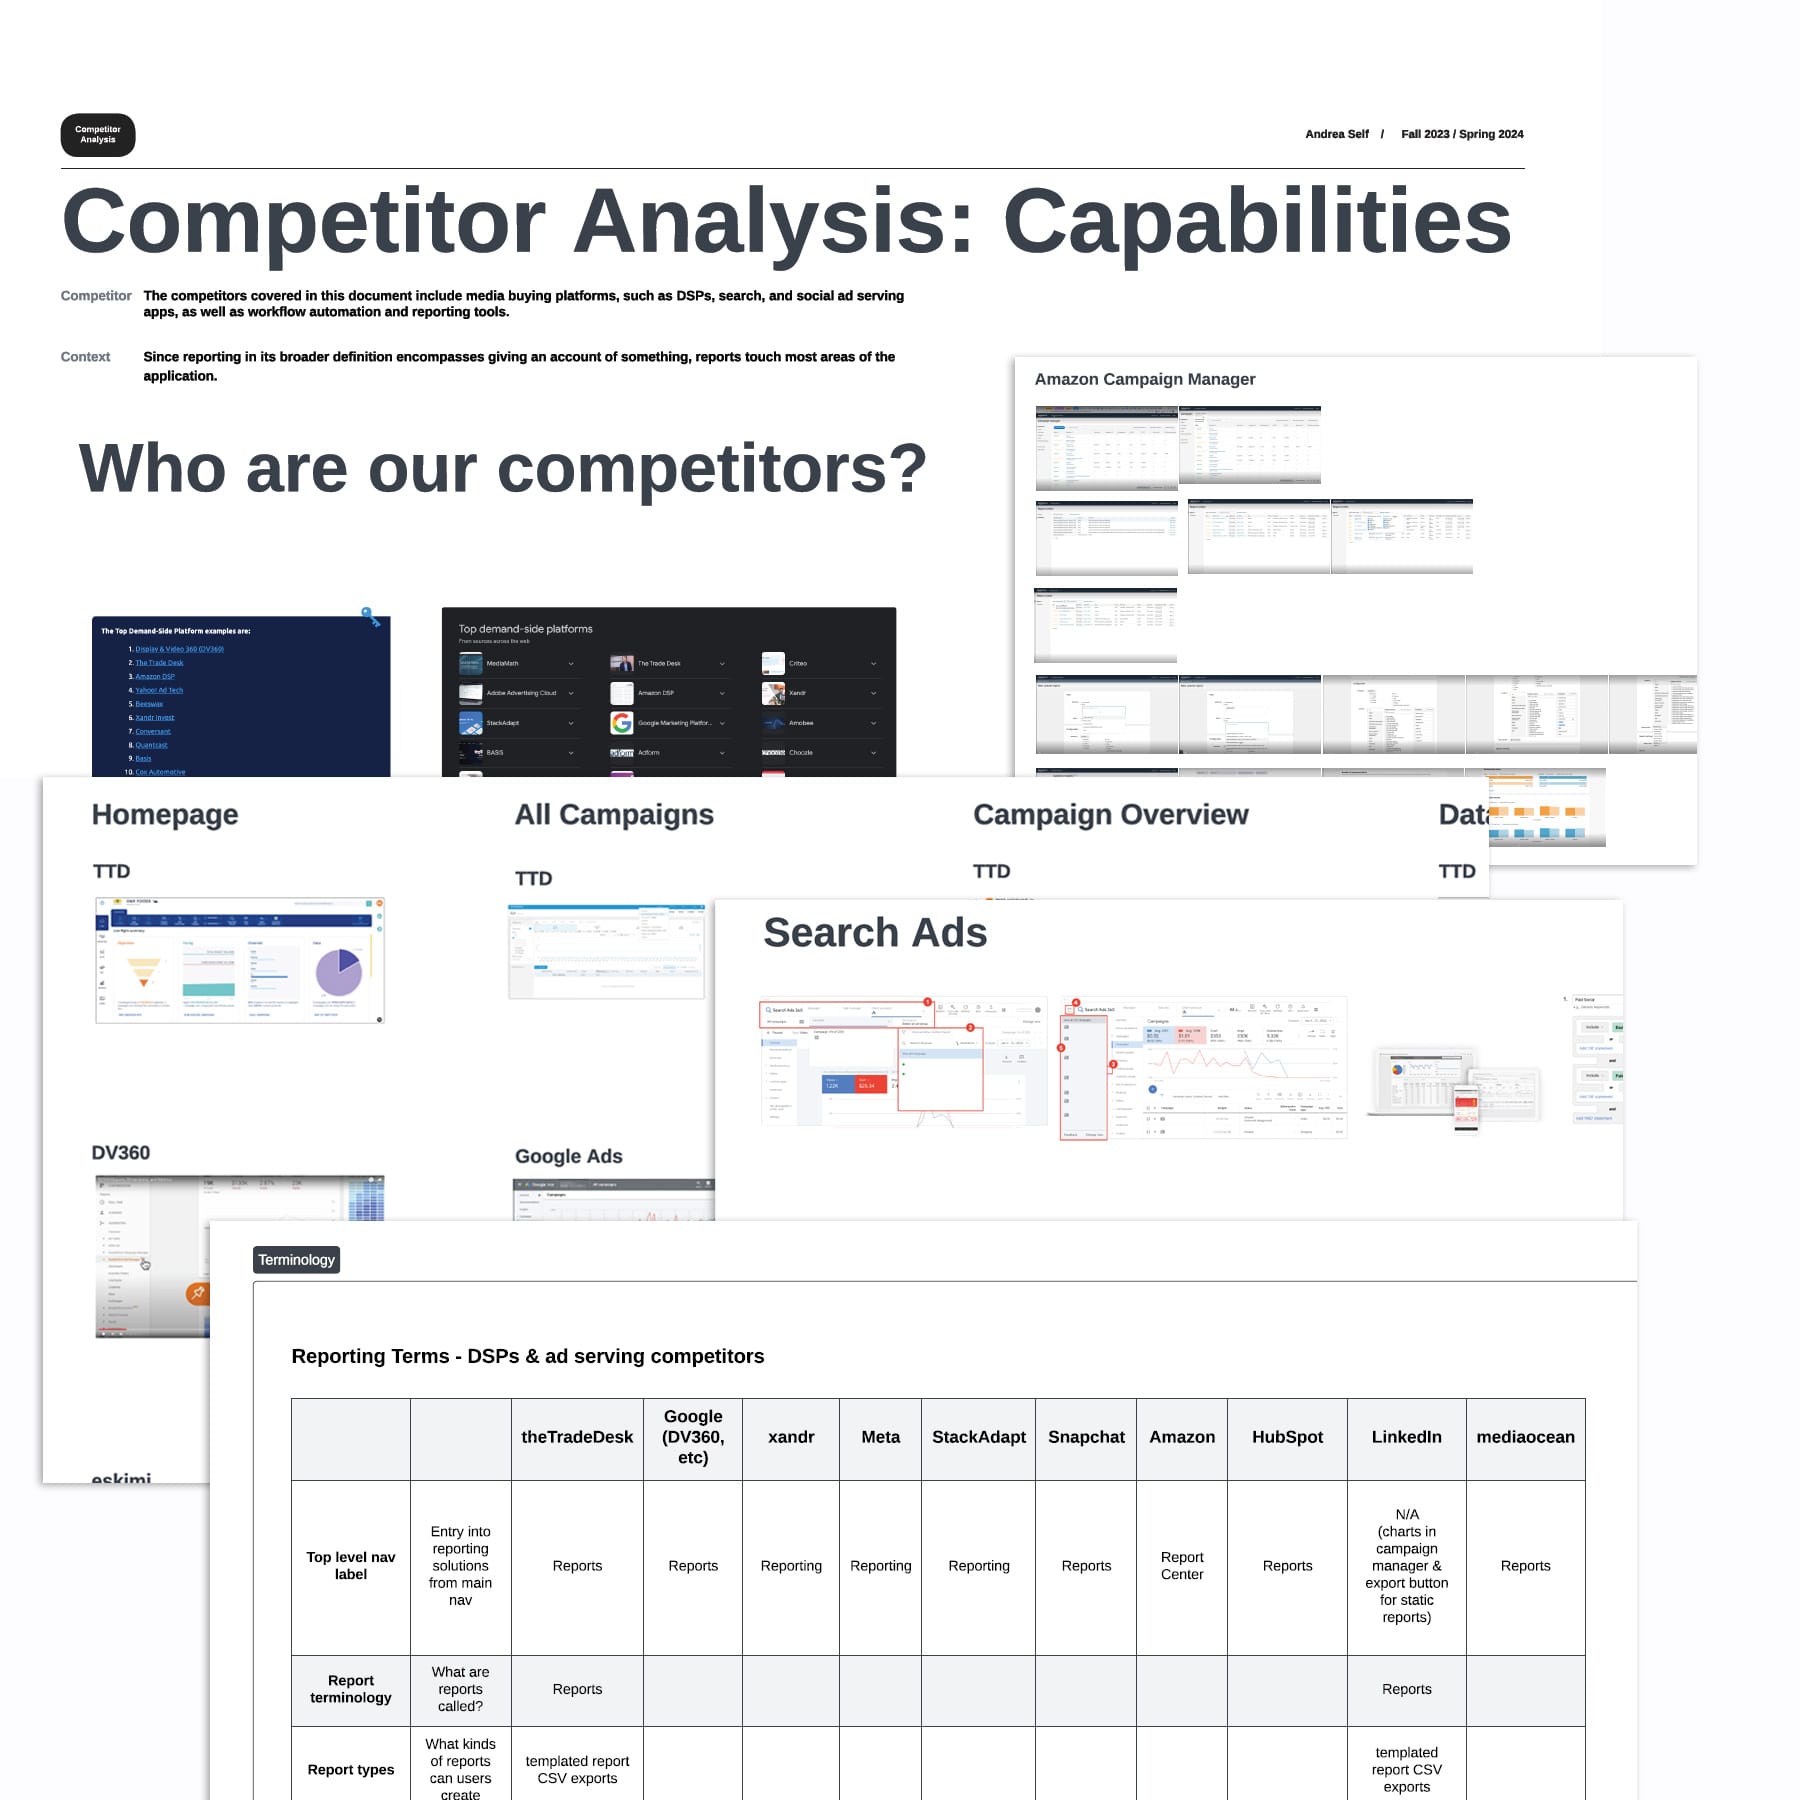
Competitive Analysis
I conducted a comprehensive review of competitors across both programmatic advertising and reporting solutions, evaluating their feature sets and overall functionality.
- 13 Demand -side Platforms (DSPs) & Ad Serving Platforms, from The Trade Desk to Google to Meta
- 11 reporting solutions, from Datorama to TapClicks to Tableau
I focused on identifying commonly used terminology related to reporting and report outputs, analyzing feature comparisons, and uncovering recurring patterns in how reports are created across platforms. Additionally, I reviewed the types of data visualizations used for various tasks to better understand how different platforms present insights to users.
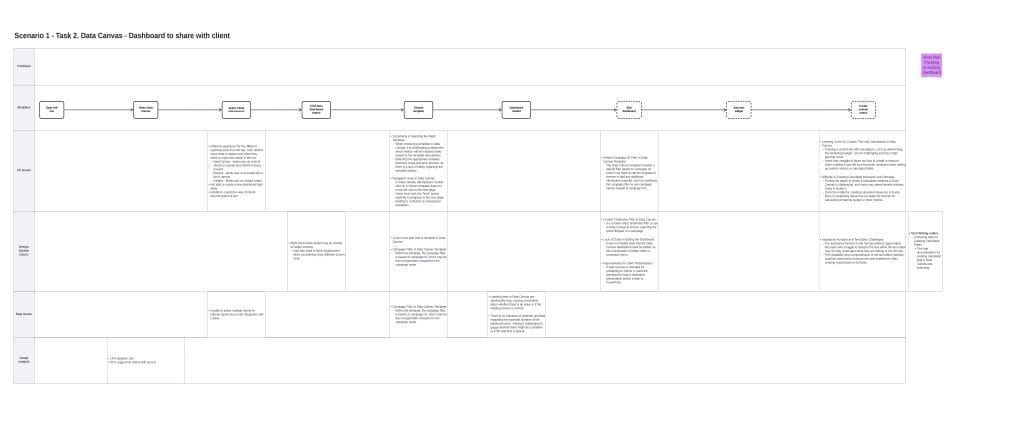
Current State Task Flows
Research and design collaborated to map out task flows that illustrate why users create reports and how they navigate existing reporting tools to do so. Below is the task flow for creating dashboards within Basis, specifically using the Data Canvas tool.
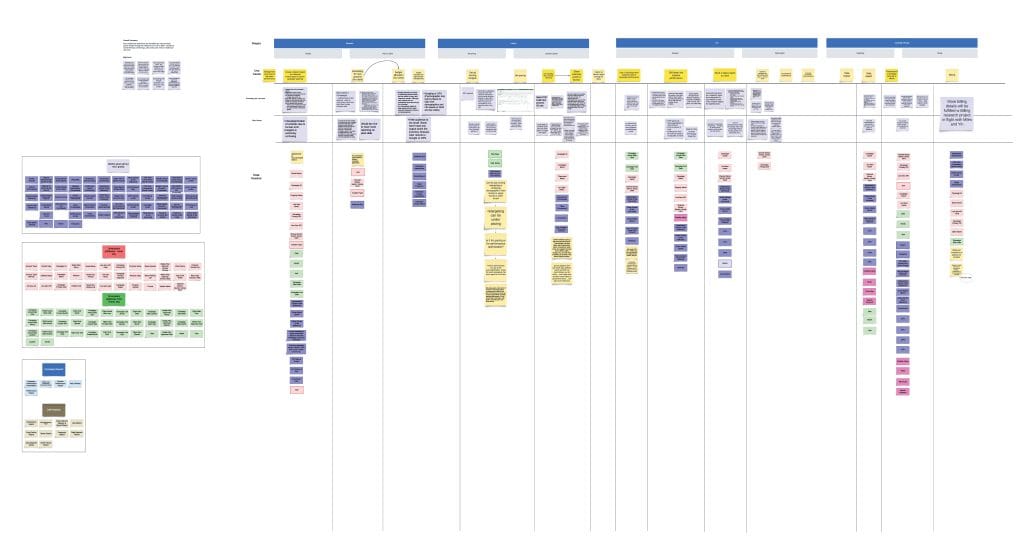
User Roles + Use Cases
Following these initial activities, the research and design teams decided to dive deeper into understanding who was performing these tasks and the motivations behind them. Through this process, we identified additional use cases that the current reporting tools were attempting to support, albeit ineffectively. Further user interviews and group sessions helped uncover more specific pain points. We also gathered valuable insights into the KPIs, metrics, and attributes users needed at different stages of the ad campaign lifecycle.
Additional findings included:
- Discovered additional organizational-level reporting needs, including budgeting and resource allocation
- Gained insights into how finance teams were using our reporting tools to troubleshoot discrepancies between contractual and actual spend
- Identified that historical reporting for campaign planning was being done with a different tool than initially understood, due to the need for more granular data
Brainstorm & Ideation
Brainstorm Activities
- Future state user flows
- MVP user flows
- Wireframes
- Usability Test
- Design Studio
- Pre-mortem
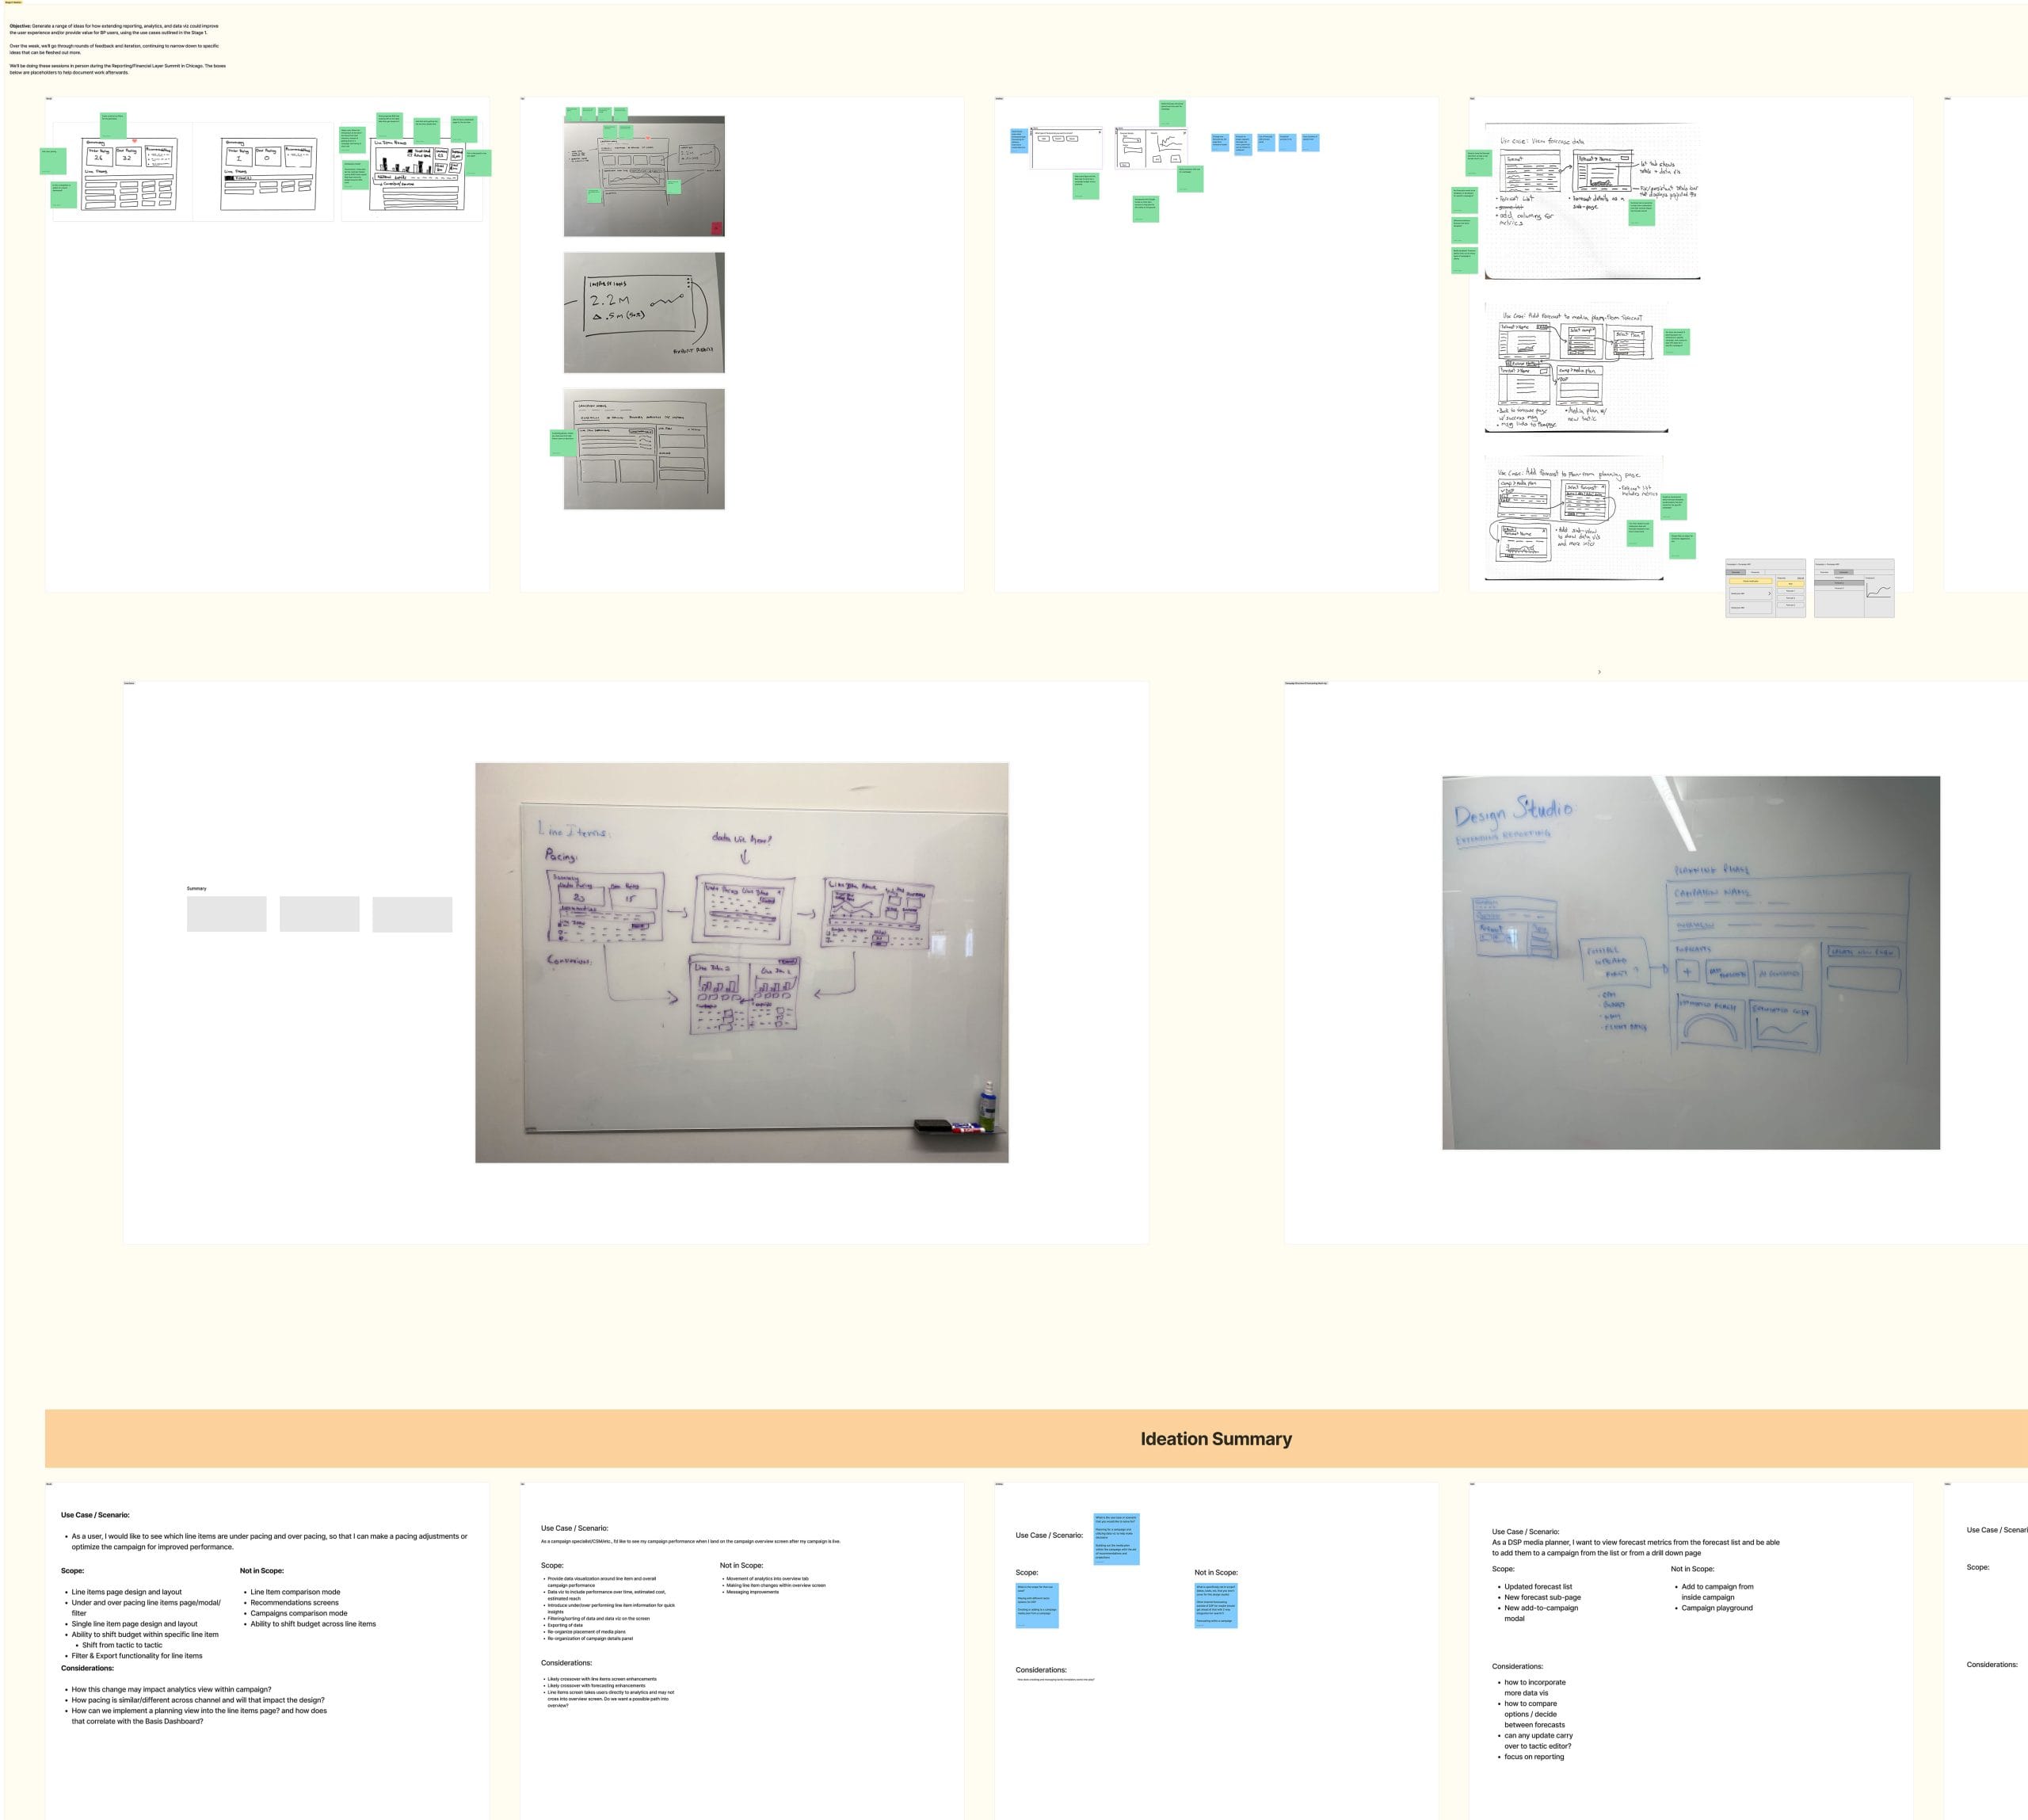
As product and engineering explored new third-party tools to support enhanced reporting functionality and visualizations, the product experience team contributed by creating future-oriented, blue-sky user flows to aid evaluation of the potential tool options.

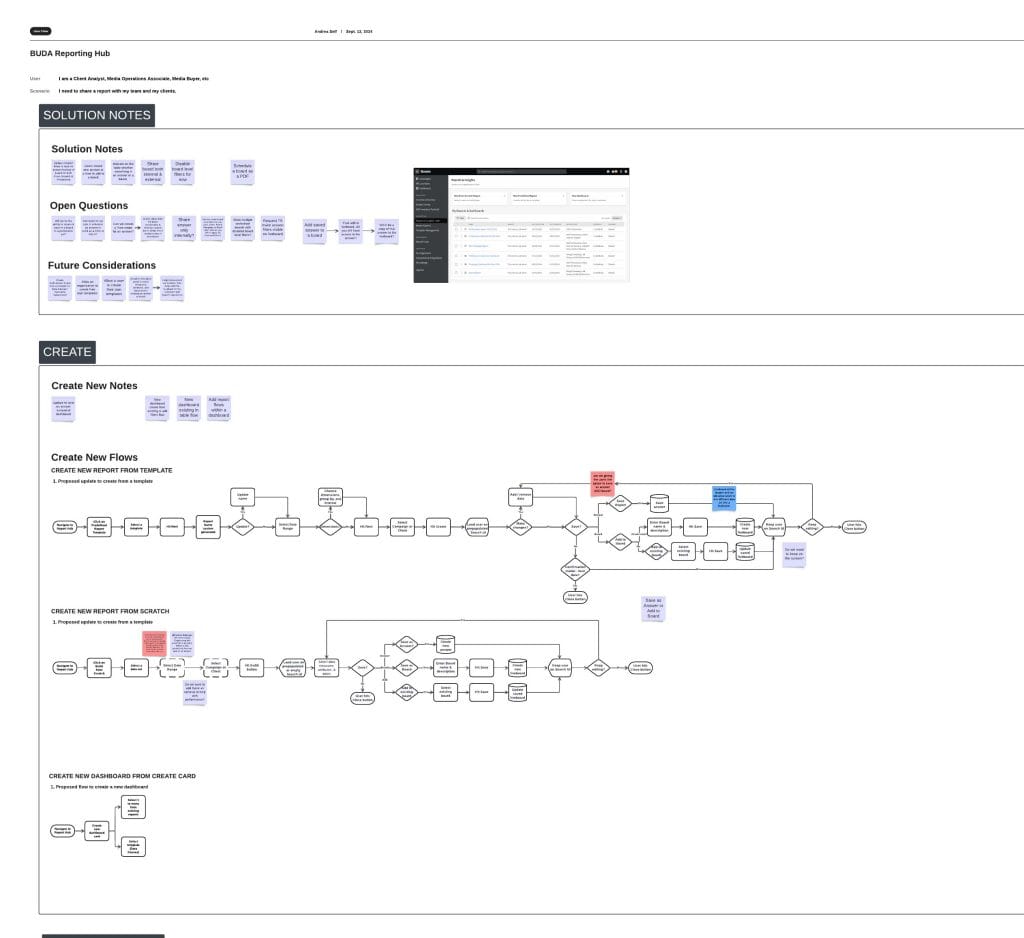
MVP user Flows
Midway through the project, the engineering team proposed a change to our integration approach with the third-party tool, ThoughtSpot. The original product plan was to use only the dashboard feature for both reports and dashboards, aiming for a consistent user experience and expanded functionality.
However, to simplify report creation and offer greater editing flexibility, we evaluated Engineering’s suggestion and ultimately shifted direction—creating distinct experiences for reports and dashboards. The following flows capture our team discussions and decisions, aimed at helping users understand the differences and how to effectively use both reports and dashboards together.
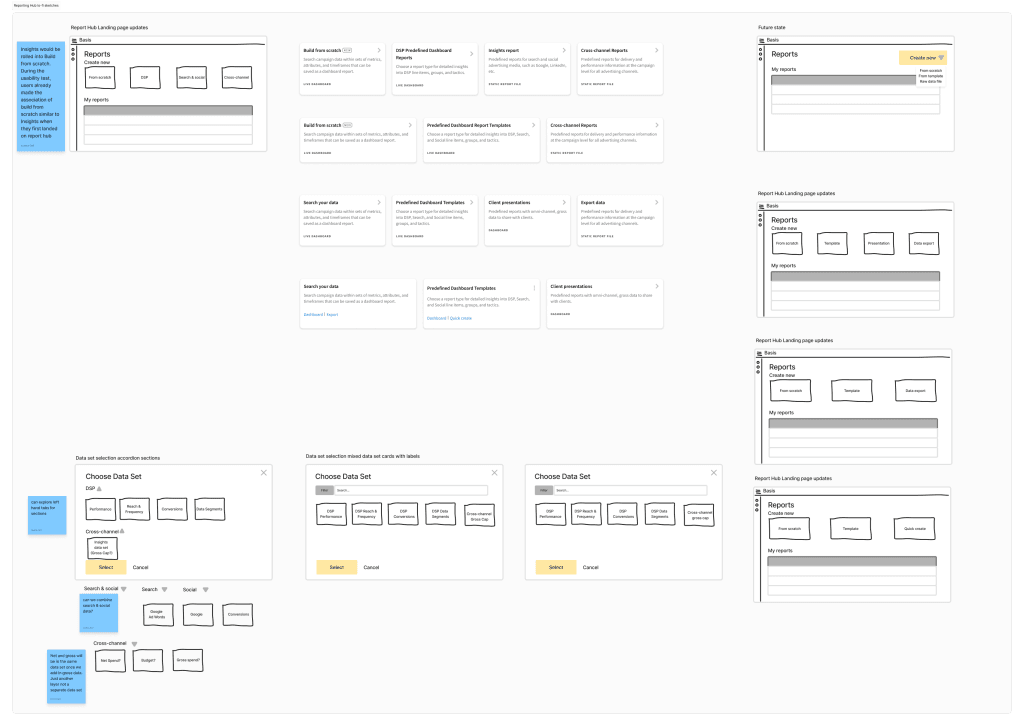
Wireframes
Throughout the project, the wireframes went through numerous iterations—driven by shifting scope and the challenge of designing a unified report hub that could serve most reporting needs, all while maintaining support for existing tools until their eventual sunset.
I collaborated with the product team to explore various approaches for guiding users in creating reports and dashboards tailored to their specific needs.
Design Studio
To get ahead of next steps beyond MVP, a group of designers and a researcher conducted a design studio to generate concepts for embedding data visualizations, analytics, and reporting capabilities within the campaign workflow.
Our goals included:
- How users might customize embedded functionality
- Drill into more granular data
- Act on the data being surfaced
- Filtering/sorting other information on the page based on the data
- Navigating to other areas of the platform
- Exporting data and/or generating a report
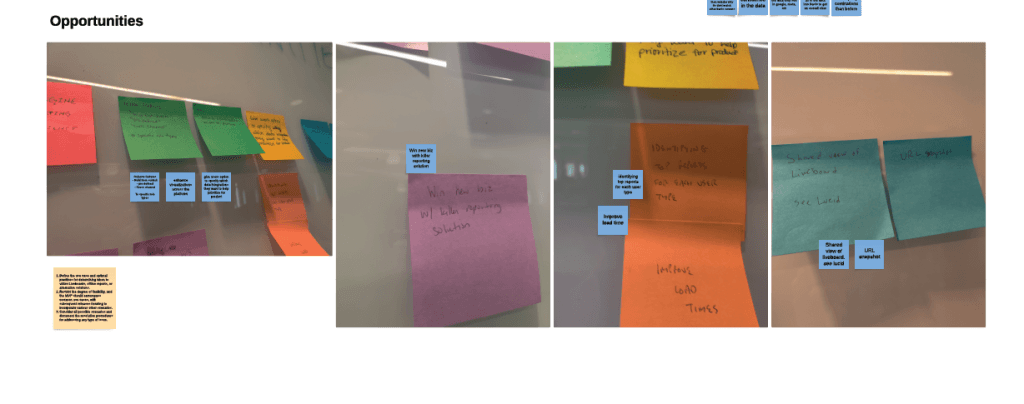
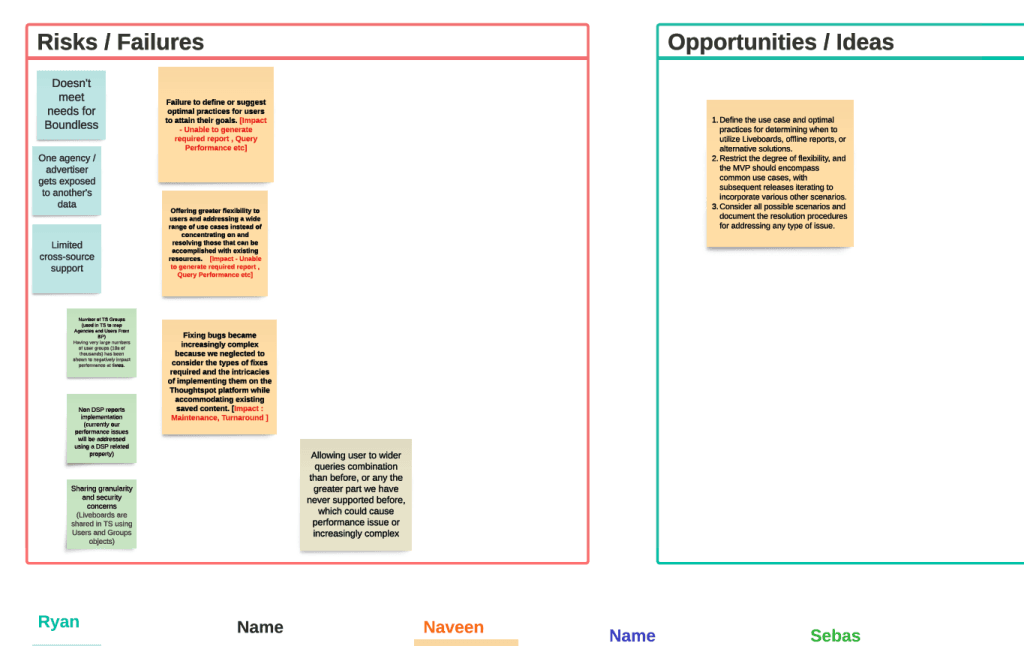
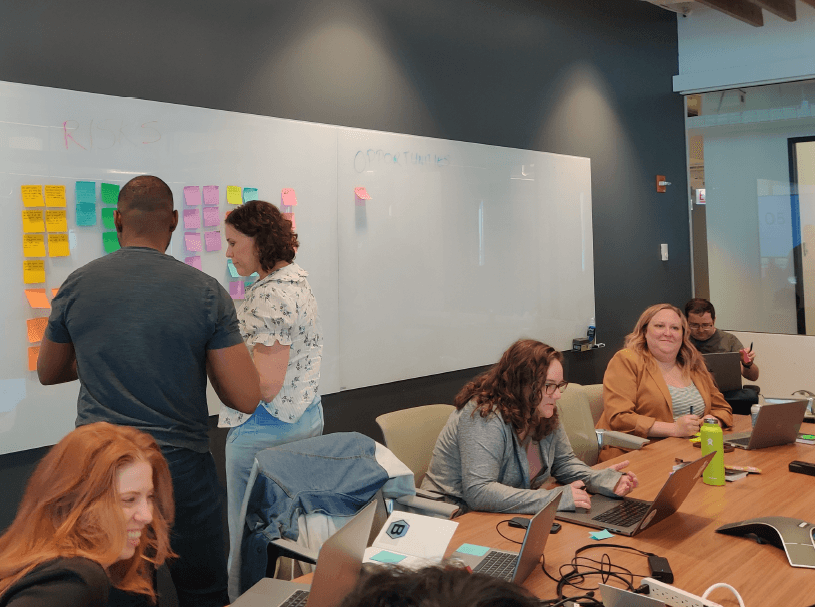
Pre-mortem
For roadmap planning and cross-functional troubleshooting a year into the project, our teams gathered in the Chicago office for a Reporting Summit. As part of the summit, we conducted a pre-mortem exercise to proactively surface potential risks ahead of the first release.
Solution
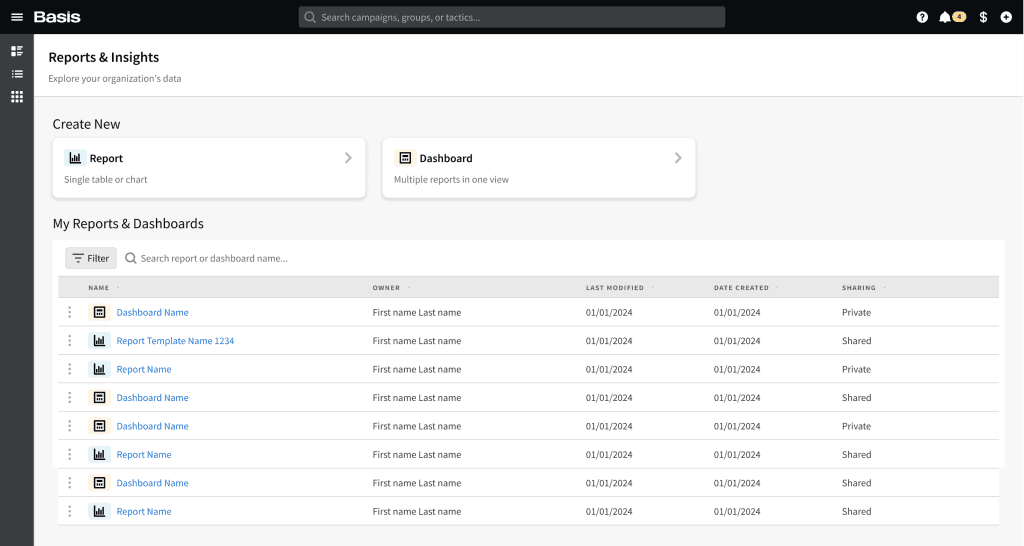
After several iterations on various options, we settled on a simple approach for the landing page: users can choose between
“Report” or “Dashboard.” From there, they can decide whether to create something custom or start with a template.
Outcomes
This project is still ongoing and set to release August 2025.
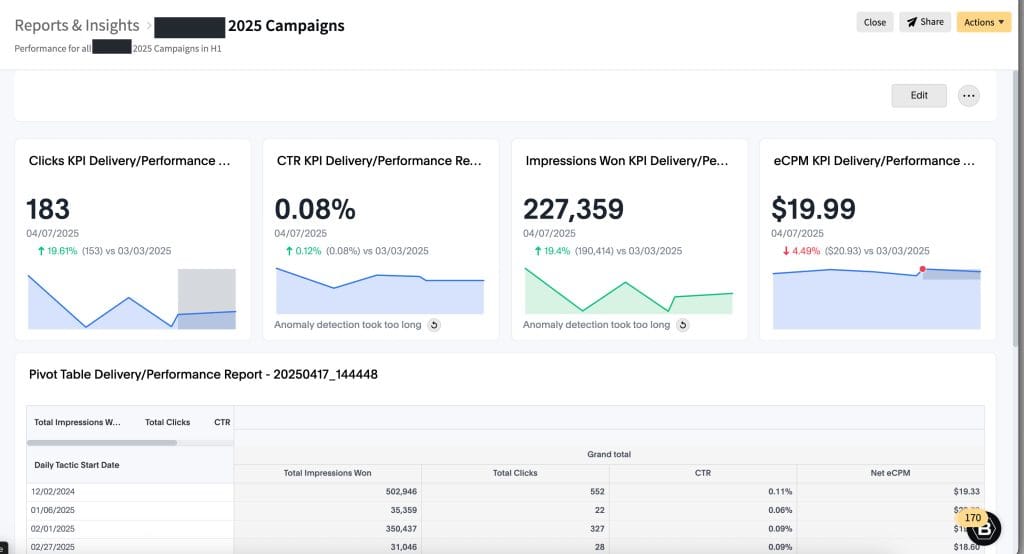
Over the past couple of months, we’ve been conducting beta testing, and the majority of feedback has been positive.
Users have expressed excitement about the additional levels of data, as well as the enhanced reporting flexibility and functionality.
Potential future state of report hub
Although these explorations are no longer valid with the addition of the different report vs dashboard experience, these designs have guided the product team to think through some future functionality.